Biophysical and Biochemical Techniques:-
Photometry; Nuclear magnetic resonance spectroscopy; Electron spin resonance spectroscopy; Atomic absorption spectroscopy; Chromatography; Electrophoresis; Centrifugation; Mass spectroscopy; Spectrophotometry
Photometry; Nuclear magnetic resonance spectroscopy; Electron spin resonance spectroscopy; Atomic absorption spectroscopy; Chromatography; Electrophoresis; Centrifugation; Mass spectroscopy; Spectrophotometry
Biochemistry is not pure, but an applied discipline and is both analytical and quantitative to explain cause and effect relationship in molecular terms. Analysis means getting to bottom of things. It is used only when combined with synthesis i.e. combining together all pieces obtained by analysis followed by extrapolation of observations to understand the whole system.
Qualitative analytical biochemistry is concerned mainly at molecular level and at times at electronic level as well. Quantitative analysis is concerned with measurement of concentration of constituents identified by qualitative analysis.
Separation and identification of particular compound from complex conglomeration in biological tissues is accomplished by various techniques such as chromatography, electrophoresis, centrifugation, mass spectroscopy, ultraviolet, visible and infrared spectrophotometry, nuclear magnetic resonance and electron spin resonance spectroscopy and so on.
Photometry is one of the powerful tool of analysis and is done at various wavelengths in the ultraviolet, visible and infra red regions of the electromagnetic spectrum. The technique is used both for identification of compounds and their quantitation. Absorption of electromagnetic radiations by compounds is highly specific phenomena. Different wavelengths have different quanta of energy. A compound will absorb only that wavelength of radiant energy which has just the same amount of energy that is needed by the compound for excitation to higher energy level. Energy absorbed in the ultra violet and visible region of the spectrum causes excitations in the electronic state of the compound to a higher level. Since this region contains high amount of energy, the absorbed energy is also capable of causing excitations in the molecular vibration and rotation states, therefore in this region we obtain absorption bands rather than line spectra. The energy requirement for molecular excitations to higher electronic and rotational vibrational levels is fixed and depends upon the structure of the molecule and only that particular wavelength having the same amount of energy as needed by the molecule would be absorbed. This wavelength of absorption is characteristic property of the molecules and is used for their identification and since amount of radiation absorbed at that wavelength is proportional to the concentration of light absorbing molecule, the technique is widely used for quantitation of the molecule.
In the infra red region, where quanta of energy in the radiations is lesser, the absorbed radiations cause excitations in the vibrational and rotational levels of the molecule. Pure rotational spectra arise in the far infra red region and are of little use to biochemists. Absorption spectra in this region are mainly used to determine specific groups in compounds.
More information about structure of many molecules can be obtained by nuclear magnetic resonance spectroscopy. In this technique the nuclear spins of molecules are excited by placing the sample between the pole pieces of strong magnet and applying variable rotating radio frequency to cause resonance. Depending upon the nuclear spin different nuclei resonate at different frequency. This property is used to distinguish and estimate different compounds having different nuclear conformation. Excellent analytical studies of compounds having unpaired electrons and free radicals is achieved by electron spin resonance spectroscopy where radiations in the microwave region are used to cause electron resonance for the analysis.
Many compounds, especially those having multiple conjugated double bonds with high degree of resonance stability, after absorbing electromagnetic radiations at a particular wavelength, exhibit fluorescence and the latter is used again both for quantitative and qualitative analyses. Atomic absorption spectroscopy is yet another powerful tool to study certain elements such as Na, K and Ca, which otherwise cannot be detected and estimated by classical methods. Mass spectroscopy sorts out ions on the basis of differences in their mass/charge ratio and is widely used to analyze various compounds including oligopeptides.
Centrifugation has been used to separate subcellular components and macromolecules by sedimenting them under enhanced and varying gravitational force. The technique is especially valuable for determination of molecular weight of macromolecules as the sedimentation rate is dependent upon molecular dimension and size.
Isotopes, in particular the radioactive ones have been employed in studying various metabolic pathways. Isotopes differ in physical property but have the same chemical behavior. Radioactive isotopes are easily detectable and are used as tags to decipher metabolic pathways, to study the kinetics of enzyme reactions and in diagnosis and therapy of many types of cancers.
Other routinely used analytical tools are different types of chromatography and electrophoretic techniques. Details of these techniques are given in different sections to follow
Bio-analysis of information processing molecules, DNA and RNA has lead to clearer appreciation of the connection between base sequences in the DNA, and how specific proteins are formed thus allowing to understand how cells differentiate during development. Artificial synthesis of DNA, using polymerase chain reaction and methods for multiplying and transferring DNA to unnatural recipients in genetic engineering have solved many hitherto unknown mechanisms and problems. All these advances that we see in the field of biological sciences owe to various physical and chemical, qualitative and quantitative techniques that have been employed by researchers.
Chromatography
Chromatography is a
separation technique, which involves the distribution of components of a
mixture between the stationary phase and mobile phase. Separation of components
in a mixture is based on the fact that the rate of migration of individual
component through adsorbent is directly related to the partition of that
component between the two phases.
Column chromatography:
Organic compounds with
the help of Column Chromatographic technique are separated .Column
chromatography is one of the most useful methods for the separation and
purification of both solids and liquids. This is a solid - liquid technique in
which the stationary phase is a solid & mobile phase is a liquid. The
principle of column chromatography is based on differential adsorption of
substance by the adsorbent.
Intermolecular forces,
which vary in strength according to their type, make organic molecules to bind
to the stationary phase. The stronger the intermolecular force, the stronger
the binding to the stationary phase, therefore the longer the compound takes to
go through the column.
Two substances under
test are mixed and the solution is poured through the column containing the
adsorbent. Different components will be immediately adsorbed and fixed in a
layer, some hold fast, while others are slow. The process of desorption occurs
when the column is irrigated with a solvent. This process is called elution. As
a consequence of desorption the components, which are held loosely, travel
faster down the column than those held strongly by adsorption force. Thus as a
result of continuous irrigation with solvent, different components can be
separated from one another in the form of distinct bands across the length of
the adsorbent column.
Intra-molecular hydrogen
bonding is present in ortho- nitro phenol. This is due to the polar nature of
the O-H bonds which can result in the formation of hydrogen bonds within the
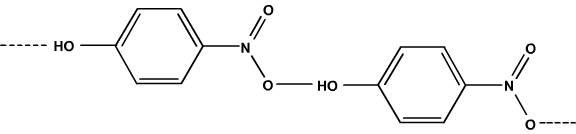
same molecule. But in para-nitro phenol, inter molecular hydrogen bonding
(between H and O atoms of two different para-nitro phenol molecules) is
possible. As result of inter molecular hydrogen bonding para-nitro phenol
undergo association that increases the molecular weight, whereby decreasing
volatility.
Para nitro phenol with
inter molecular hydrogen bonding:
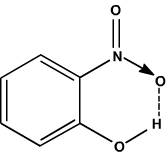
Ortho nitro phenol with
inter molecular hydrogen bonding:
Procedure:
1. Preparation of the column:
Ø Place the column in a ring stand in a vertical
position.
Ø A plug of glass wool is pushed down to the
bottom of the column.
Ø Prepare slurry of silica gel with a suitable
solvent & pour gently into the column.
Ø Open the stop cock & allow some solvent to
drain out. The layer of solvent should always cover the adsorbent; otherwise
cracks will develop in the column.
2. Adding the sample to the column:
Ø Dissolve the sample mixture in a minimum amount
of solvent (petroleum ether).
Ø Remove the solvent by placing the mixture in a
rotary evaporator at a low temperature.
Ø Place the dry powder on a piece of weighing
paper and transfer it to the top of the column through the funnel.
3. Developing the chromatogram:
Ø Attach a dropping funnel filled with petroleum
ether on to the column.
Ø Add petroleum ether continuously from the funnel
to the top of the column.
Ø Open the stopcock carefully.
Ø The components of the mixture run down the
column forming two separate yellow bands.
4. Recovering the constituents:
Ø Continue running the petroleum ether till both
the bands are eluted out separately.
Ø Collect the constituents in two different R.B
flasks. (Ortho nitrophenol is obtained first, followed by para nitro phenol.).
Ø Evaporate the solvent by placing the mixture in
a rotary evaporator.
Books:
1. Frederick George Mann, Bernard Charles Saunders,
Practical organic chemistry. 1960
2. Solomons, Fryhle. Organic Chemistry, 8th Edition
Wiley-India, 2006.
3. The systematic identification of organic
compounds by Ralph L Shriner 8th edition
Spectrophotometry
Spectrophotometer measure the absorbance of the sample
at different wavelengths, find out the unknown concentration of the sample through
Beer - Lambert's law.
A
spectrophotometer is a photometer that can measure the intensity of light as a
function of its wavelength. Single beam and double beam are the two major
classes of spectrophotometer. The single beam spectrophotometer measures the
relative light intensity of the beam before and after a test sample is inserted
and the double beam spectrometer compares the light intensity between two light
paths, i.e. one path containing the relative light intensity of the beam before
and after a test sample is inserted and the instruments are easier and more
stable whereas the single beam instruments can have a larger dynamic range and
are optically simpler and more compact. Spectral bandwidth and linear range of
absorption measurement are the important features of spectrophotometers.
In transmission
measurements the spectrophotometer quantitatively compares the amount of light
passes through the reference and test sample and for reflectance it compares
the amount of light reflects from the reference and test sample solutions.
Many
spectrophotometers must be calibrated before they start to analyse the sample
and the procedure for calibrating spectrophotometer is known as
"zeroing." Calibration is done by using the reference substance, i.e.
the spectrophotometer is set as a baseline value, so the absorbencies of all
other substances are recorded relative to the initial "zeroed"
substance. The spectrophotometer then displays % transmissivity (the amount of
light transmitted through the substance relative to the initial substance).
The major
sequence of events in spectrophotometry is as follows:
1. The
light source shines through a monochromator.
2. An
output wavelength is selected and beamed at the sample.
3. A
fraction of the monochromatic light is transmitted through the sample and to
the photo-detector.
Single beam spectrophotometer:

Spectrophotometry deals with visible light, near UV and near IR.
Especially for IR spectrophotometers, there are spectrophotometers that use a
Fourier transform technique to acquire the spectral information quicker in a
technique Called Fourier Transform Infrared
Different Types of Spectrophotometers:
A. Single Beam: In this all the light passes
through the sample and to measure the reference intensity of the incident light
the sample must be removed so that all the light can pass through. This type of
spectrometer is usually less expensive and less complicated.
B. Double Beam: In
this type the light source is split into two separate beams before it reaches
the sample. From these two beams one is used for reference and the other passes
through the sample. This is advantageous because the reference reading and
sample reading can take place at the same time.
C. Visible Light (400-700 nm): Visible region spectrophotometers vary
in accuracy. These spectrophotometers can use incandescent, halogen, LED, or a
combination of these sources.
D. Ultraviolet Light: UV
spectroscopy is most commonly used for liquids, but can also be used for gases
and even solids. Samples are placed in a cuvette, which are made of plastic,
glass, or quartz. Plastic and glass absorb UV, so they can only be used for
visible light spectroscopy.
E. Infrared Light: Infrared
spectroscopy is used to study molecules and the vibrations associated with
their structures. Due to the varying energies associated with each wavelength
different chemical structures vibrate in different ways in response to
different wavelengths. For example, mid-range infrared tends to cause
rotational vibrations, while the near infrared (higher energy) tends to cause
whole molecule harmonic vibrations like stretching, and rocking.
Beer - Lamberts law:

Diagram of Beer-Lambert absorption of a beam of light as it
travels through a cuvette of width l.
Beer Lambert’s law is the linear relationship between the
absorbance and concentration of the absorbing sample, i.e. there is a
logarithmic dependence between the transmission (or transmissivity), T, of light through a substance
and the product of the absorption coefficient of the substance, α, and the distance the light
travels through the material (i.e. the path length), l. The absorption coefficient
can be written as a product of molar absorptivity of the absorber, ε, and the concentration c of absorbing species in the material,
or an absorption cross section, σ,
and the (number) density, N,
of absorbers.
For liquids, these relations are usually written as:

Whereas for gases, these
relations are written as:

where,
I0=intensity of the incident light
I=intensity of the transmitted light
σ=cross section of light absorption by a single particle
N=density of absorbing particles
The transmission (or transmissivity) for liquids in terms of
absorbance, is defined as:

The relationship between
absorbance (A) and percent transmittance (%T) is also quantitative and this can
be written as:

Percent transmittance
is

Whereas, for gases, it is usually defined as:

This shows that the absorbance becomes linear with the
concentration (or number density of absorbers) according to:

and

Thus, if the path length and the molar absorptivity are known and
the absorbance is measured, the concentration of the substance can be deduced.
According to the Beer-Lambert Law, absorbance is proportional to
concentration, so that at dilute solutions a plot of concentration vs.
absorbance would be straight line, but the Law breaks down for solutions of
higher concentration, and so you might get a curve under those circumstances.


Applications of a
Spectrophotometer
1. It directly used to measure light intensity at different
wavelengths
2. It is used to determine the unknown concentration of
solution
3. Spectrometers can be used to determine the equilibrium
constant of a reaction involving ions
Books:
1. Modern Instrumental
Methods and Techniques - John Wiley & Sons, West Sussex, Skoog D A
2. Instrumental methods
of analysis - Willard, Merritt L L, Dean J, Sette P A
3. Vogel's textbook of
quantitative chemical analysis - Arthur Israel Vogel, John Mendham
No comments:
Post a Comment